How to - Reduction Module
Any questions you may have regarding our Reduction Module we are hoping to answer on this page 😊
Dashboard
How do I use the dashboard?
The dashboard provides a status report for the data you have entered. The process summary enables you to see your progress thus far and a forecast for the years ahead.
Actions
What are feasibility, time effort and impact?
Feasibility indicates how easily an action can be implemented. Time effort represents the length of time it will take to complete a task. Impact outlines the influence of an action on CO2e emissions reduction.
Where do I find my actions? Link will follow
How do I start an action?
Go to the action page. Here you have two choices:
- Below “Timing” click “start action”
- In the top right corner of the action is a dropdown, choose “in progress” and the action is started
How can I assign an action to a team member?
Go to the action page, below “General” you can assign the action to a user.
Can an action be allocated to several persons?
No, this is not possible. An action can only be allocated to one person and one place at any given time.
Can I retrieve a deleted action?
A deleted action cannot be retrieved. Only Global Changer can restore it. Please contact us at support@globalchanger.com if required.
How can I create and add actions myself?
The admin can use the “+ Add an action” button in the header to add new actions at any time. Select a name, input relevant data and parameters. Then click on “save” in order to add the action to your roadmap under “pipeline”.
How do I use tags?
To customize the software to your needs, you can add tags to your actions. This helps you to assign actions to a department, for example, or to set a priority. You can also use internal terms here. There are no limits to the application here. Find the tags in the header part of each action. You can create new tags or select tags that have already been added by clicking on the plus symbol next to the tag icon. Select "Create new tag" and type in the desired term. Confirm your entry with Enter. Or select an existing tag by clicking on the term. Tags are visible to all team members.
How do I delete tags?
Tags are displayed until you manually delete them. To delete tags, go to the action detail page and simply click on the "X" in the top left corner of the relevant tag. The tag will be deleted and the action will no longer be associated with that tag or search term.
Will my tags also be displayed on the roadmap?
The action tile on the roadmap always shows the first tag that has been added. A "+" and a number indicate that there are more tags and how many tags there are. To see all tags, please open the detail page of the action. All tags are always displayed there.
Is it possible to search for tags?
The search box on the roadmap gives you the option to search for tags. Simply click in the search box and enter the tag you are looking for. Only the actions with this tag will then be displayed on the roadmap. To display all actions again, simply delete the search term from the search field.
What does the shield symbol mean?
Once you have entered your carbon accounting data in the Climate Control Center's assessment, we will provide you with an estimate of the CO2e reduction potential of a particular action. This indicator is shown by a shield symbol with 4 different states.
How is the reduction potential of an action calculated?
The estimate is based on scientific data and actual experience, and is also related to your Co2e emissions in the different scopes and the implementation options. We would like to point out that our estimate can never show exact values for your company. Only if you have calculated the reduction yourself and entered it within the corresponding action, you can be 100% sure that your value is correct. Nevertheless, our estimate gives you a guideline value and you can thus weigh up more quickly how relevant the implementation of an action is.
What does the status of the reduction indicator mean?
The indicator shows how high the reliability of the indicated reduction potential is. There are four different levels indicating the reliability of the indicated value. High: you have entered the data yourself, so the value is 100% validated on your part. Medium: we have deposited a generally valid calculation based on generally accessible data from science and industry. Low: we have made an estimate based on feasibility and scientific predictions. None: in this case, no estimate is possible because we do not have valid data on this. The statuses are explained via a tooltip when you move the mouse over the shield symbol.
How can I edit the reduction indicator?
All indicators can be edited individually, each on the corresponding action detail page. On the action detail page, you will find the indicator next to the Savings CO2e/year field. Adjusting the value may change the status of the indicator. On the year tiles in the top row of the roadmap, you will also see the shield symbol. This cannot be edited but is the average value of the reduction potential of all actions in this year. The same applies to the indicator in the year view. Here, too, editing is not possible because it is also the average value of the reduction potential of all actions in this year.
Can I enter calculated data for an action such as CapEx, OpEx, planned savings, etc.?
Yes, you can do this in the "Budgeting" section. In this section, you have the possibility to enter data that you have for this action, such as an exact calculation of CO2e savings, financial expenses and savings, as well as saved kWh and usage time in the case of energy actions. This feature helps you understand at a glance the impact that this action has on your company and your CO2e footprint. Additionally, you can better assess the potential of the action.
Roadmap
How do I see all the actions on the roadmap?
The roadmap sections "In progress", "Pipeline", "Paused" and "Done" are minimised for a better overview. To see all actions of a section, click on the angle icon (”Show all”) at the top right of the section title. To minimise the view again, click on the angle icon again.
Can I update the timeline on the roadmap?
You can update the timeline on your roadmap by altering your net zero goal (Assessment > Reduction Path). You can also drag & drop different actions into other quarters or years on your roadmap.
How is the CO2e emissions forecast calculated for the different years on the roadmap?
In the roadmap view, there are different numbers on the year tile. The value on the right of the year tile represents the greenhouse gases (in tons) which your company can release in the given year in order to reach the climate goal.The “target” indicates by how much you need to reduce your CO2e accounting in comparison to the previous year. As this is calculated linearly with the base year, this sum does not change. The “scheduled” number is calculated on the basis of the tons of CO2e emissions saved each year through the actions. The reduced CO2e emissions are only registered on the tile when the actions are “completed”.
Categories
Why are there different categories?
For an even clearer insight into the actions, we have sorted them into categories as well as scopes. The categories illustrate in which area implementation plays a role.
Can I add categories?
No, this is not possible. If you need an additional category, pleasecontact us.
Insights
What will I find under the menu item "Insights"?
"Insights" gives you an overview of all actions and their corresponding data for your company (including all organizational units) in a single table. The table can be filtered and the number of columns can be customized. In addition, you can use the search function to search for keywords and thus reduce the number of actions displayed. At the bottom of the table you will always find the sum of all data, such as the Savings CO2e per year.
How can I filter the table?
The content of most columns can be filtered. To do this, move the mouse over the column title and several icons will appear. Click on the filter icon to the right of the column title and select the desired filters from the dropdown list. To undo the selection, you can click the checkboxes in the dropdown again or use the button on the right above the table "Clear filters". This button resets all filters to the default setting.
How can I change the position of columns?
All columns can be moved to the left or right. To do so, move your mouse over the column title, and several icons will appear. Click on the three-dot icon to the left of the column title and hold it, then simply drag the column to the desired position and release. You can move all columns as often as you like.
Is it possible to customize the selection of columns displayed?
Yes, this is possible. Click on the button "Column view" on the right above the table. A window opens, select or remove columns via the checkboxes. You can adjust and reset this setting at any time.
Can I sort the column contents?
The content of most columns can be sorted. Move the mouse over the column title and several icons will appear. Click on the arrow icon, this will reverse the sorting of this column, e.g. from originally A-Z to Z-A. Only one column can be sorted at a time. To reset the setting, click on the "Delete sorting" button on the right above the table. This button resets the sorting to the default setting.
Can I search for specific content?
Yes, use the search field on the left above the table. Enter a search term and all tags and action titles will be searched for this term. Only the actions associated with this search term will appear in the table. You can undo your selection by deleting the search term from the search field.
What do the 4 values at the top mean?
The four values show your:
- Reduction target: The reduction target is calculated by the emissions of your base year and the reduction percentage set by you in your Reduction Path.
- Achieved reduction: Accumulates all “Savings CO2e” entered on actions that were set to done.
- Planned reduction: Accumulates all “Savings CO2e” entered on actions that are in progress, paused and in pipeline.
- Gap: The gap calculates the difference between what you have planned and achieved compared to you reduction target.
Note: If the structure of your organization has various units and your unit has others “below” it in the structure, then the insights view will aggregate their data. You can use the company filter right below the search field to filter for certain organizational units.
Furthermore, the four values at the top can only be filtered by using the two filters for companies and time period. The values will then adjust according to the filters. If you filtered by a quarter, the yearly reduction target will be divided by four.
Assessment
How can I enter my company's carbon accounting data?
The administrator can enter carbon accounting data in Reduction > Carbon Footprint. The emissions are classified in the scopes of the Greenhouse Gas Protocol (GHG). Use the plus sign + in the top right-hand corner to add data for new years.
If you are using our footprint module as well, you can use the “Transfer” button on the result page to transfer your CCF from the footprint module to the reduction module (available 25th of March).
How can I change the climate goal/ target year for my company?
You can change your net zero goal in Reduction > Reduction Path. Note: Changing your goal will be reflected on your roadmap. You won’t be able to restore the original position of actions that are shifted in this process. E.g. if there are actions currently located in a year later than your new target year, those will be moved to the new target year. Reversing back to the previous target year won’t locate the actions back.
How do I set a base year?
You can set a base year under Reduction > Reduction Path. The drop-down menu shows the years in which carbon accounting data has been stored. Select the appropriate year and your base year is set. It serves as the starting point for all calculations regarding your CO2e reduction. Please note that if you have not entered any carbon accounting data, no year can be selected. You can enter your carbon accounting data under the menu item Reduction > Carbon Footprint.
How do I edit the reduction value?
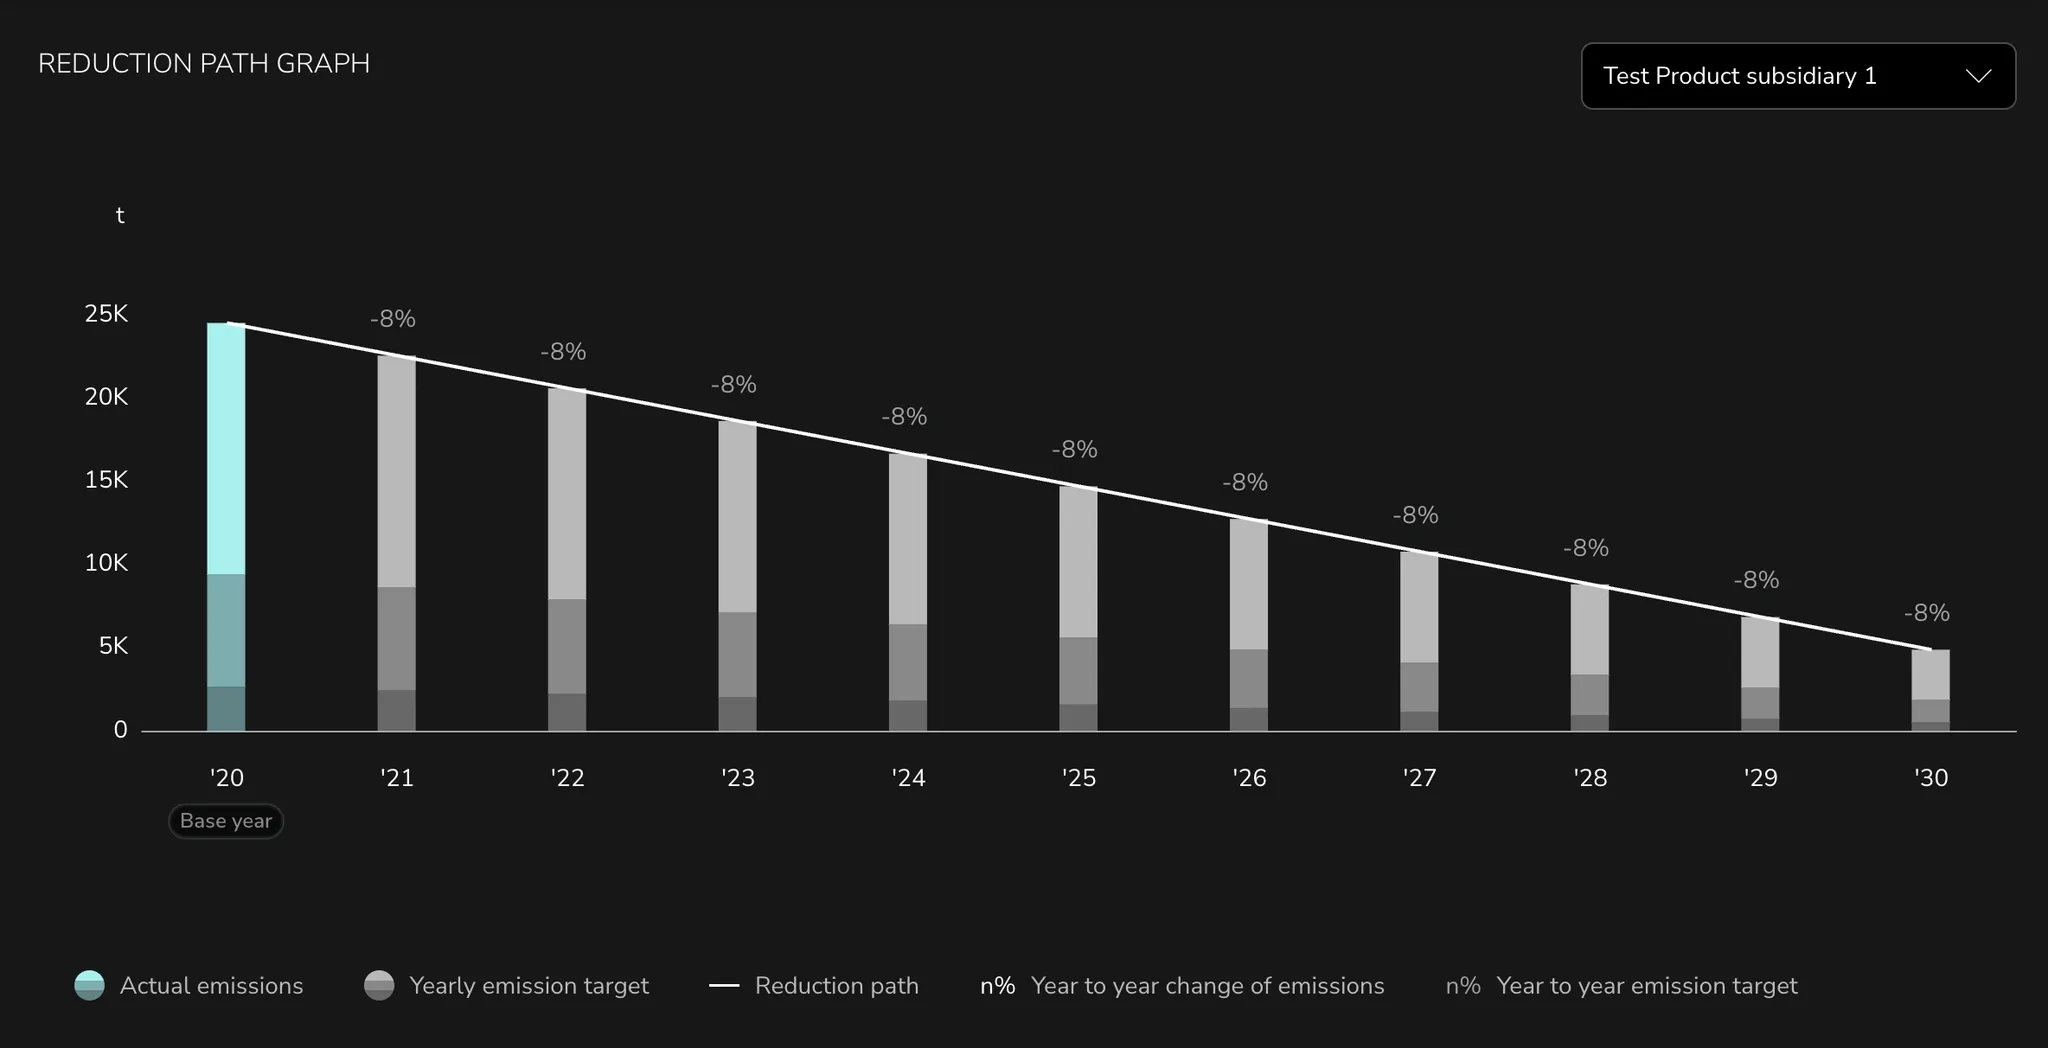
Go to Reduction > Reduction Path. Here you have two options to choose from. You can either select a linear reduction with the same amount for each year or you can individualize your reduction. You can enter individual percentages per, scope or subscope. Your reduction path will be visualized on a graph on the dashboard as well.
What is the Action Data Base?
The Action Data Base contains all actions from the Global Changer Data Base as well as all actions that you or your colleagues added yourselves.
From here you can view all actions and decide which ones to add to or take from your roadmap.
There are two views available. You can either look for actions by scope or by categories.
By switching on the toggle on the right of an action you activate it and the action will be added to your roadmap in current year and quarter. When deactivating an action it will be taken from your roadmap and any changes that have already been made on the action will be stored.